
Analytics
Analytics shows how the business is doing across every app you use, on one page. You can also build your own charts and tables from your records, without writing code.
Owners and managers use the Business overview. Anyone who needs a figure the standard pages do not give builds it with Build a query and keeps it in Saved analytics.
Analytics counts only the records you are allowed to see, and only from the apps that are switched on. Two people can see different figures on the same page.
The everyday menu
Section titled “The everyday menu”| Entry | What it is for |
|---|---|
| Business overview | Key figures across the business |
| Saved analytics | Your dashboards, charts and queries |
| Build a query | Make a chart or table from your records |
Read the business overview
Section titled “Read the business overview”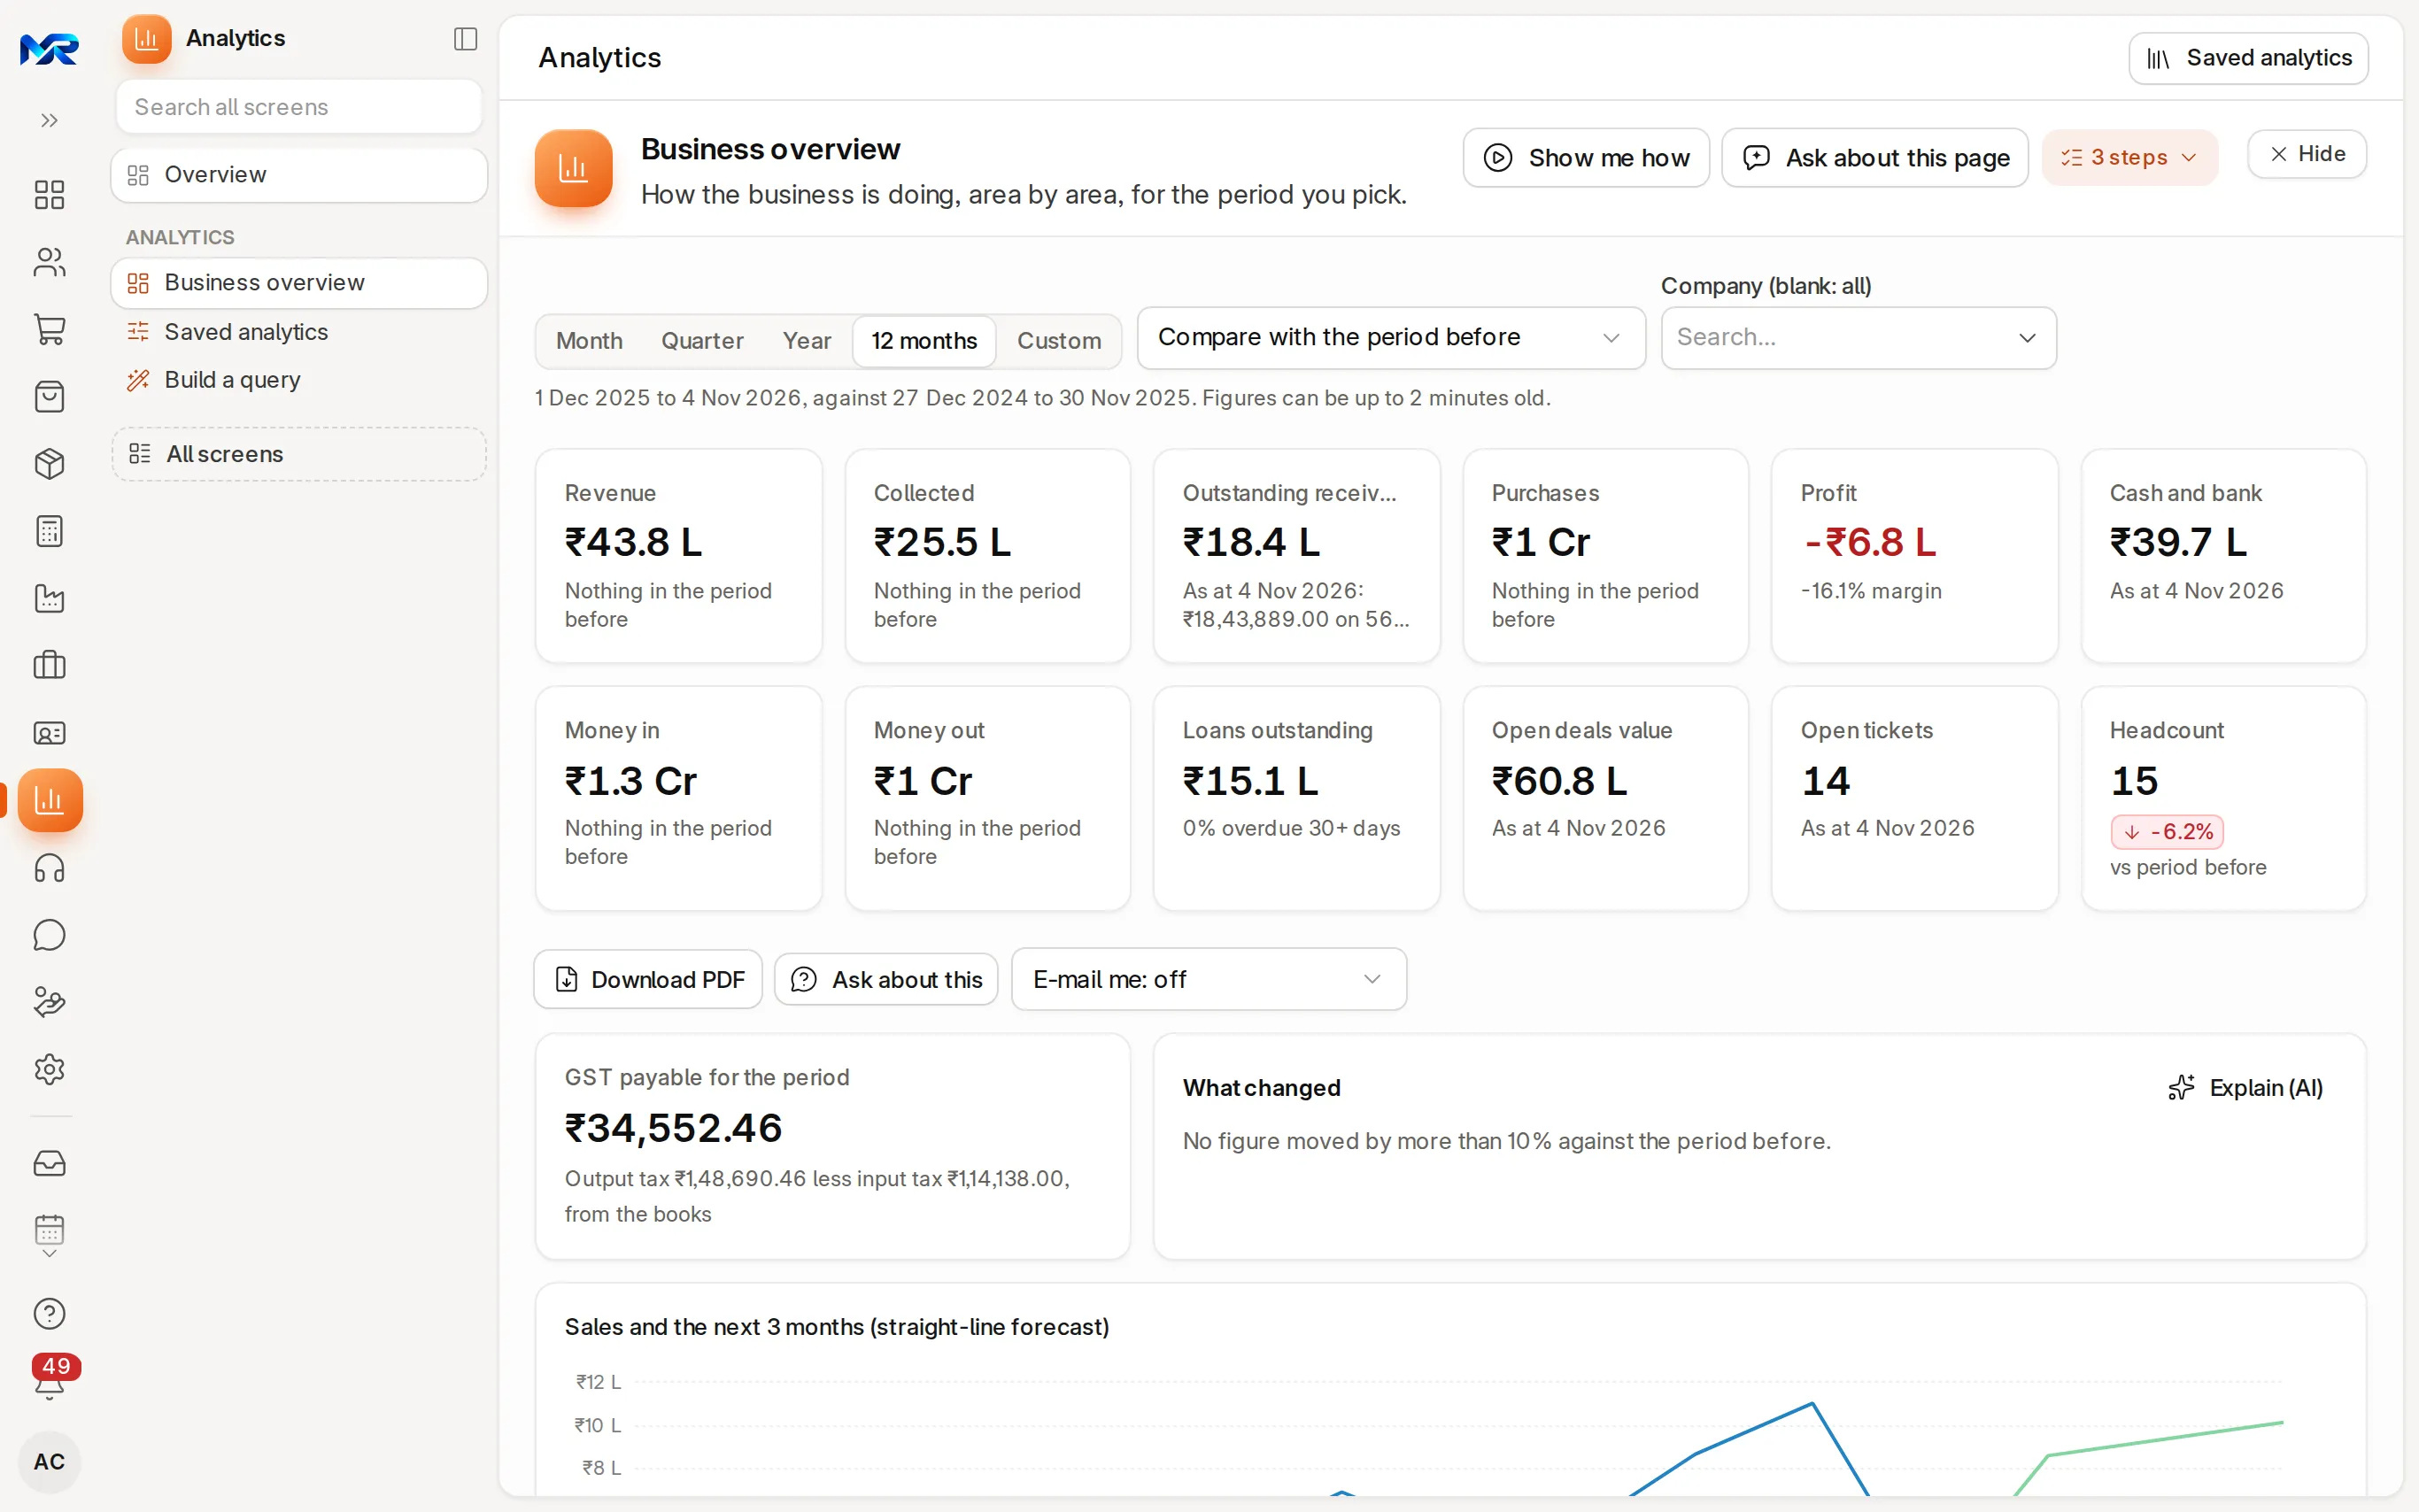
- Pick the period: Month, Quarter, Year, 12 months (the default) or Custom. The line under the tabs gives the exact dates and the dates compared with.
- Choose what to compare with, for example Compare with the period before, and, if you have several companies, one company (blank means all).
- Read the key figures: revenue, collected, outstanding receivables, purchases, profit, cash and bank, money in, money out, loans outstanding, open deals value, open tickets and headcount. Each shows the change against the comparison period, or the date it is “as at”. Click a figure to open the records behind it.
- Scroll through the sections: Sales, Purchases, Profit and cash, Stock, Lending, CRM, Support and HR. A section appears only for an app you can see.
| Figure | What it adds up |
|---|---|
| Revenue | Submitted sales invoices dated in the period |
| Collected | Payments received from customers in the period |
| Outstanding receivables | What customers still owe on submitted invoices, as at today |
| Purchases | Submitted purchase invoices dated in the period |
| Open deals value | CRM deals that are neither won nor lost |
| Open tickets | Support tickets that are neither resolved nor closed |
| Headcount | Employees whose status is Active |
More on the page:
- GST payable for the period: output tax less input tax, from the books.
- What changed lists the notable movements; Explain (AI) writes them out in plain words.
- Sales and the next 3 months draws sales with a straight-line forecast: a guide, not a promise.
- Download PDF keeps a copy; E-mail me sends you the overview regularly (off by default); Ask about this lets the AI assistant answer a question about these figures.
Every chart has small buttons at its top right: show it as a table, Add to my dashboard (puts the chart on your Home), Download PNG and Download CSV. Click a bar to see the records behind it.
Build your own query
Section titled “Build your own query”- Open Build a query. Pick By business object (customers, invoices, items, employees, tickets and so on) and give the query a title, for example “Sales by month”.
- Pick the columns: tick the columns to show. For numbers, choose how to combine them: sum, count, average, minimum or maximum, and what to group by.
- Join a second table (optional) to bring in columns from a related record.
- Filters (optional): keep only the rows you want. Every filter must match.
- Press Save & Run. The result appears below.
- Under Chart, pick a bar, line or number chart and the value column, then Save chart.
Saved analytics and dashboards
Section titled “Saved analytics and dashboards”Saved analytics has four tabs: Charts, Dashboards, Queries and Alerts on.
- Pin to Home puts a chart on your Home; Share gives a colleague the chart and its query.
- New dashboard puts several saved charts on one page, or start from Ready-made dashboards (templates). On a dashboard, set the filters and press Apply.
- E-mail me this weekly sends you a chart or dashboard every Monday. An alert e-mails you when a query’s result meets a condition.
Who sees this
Section titled “Who sees this”- People with the Analytics user role read the overview and saved analytics; the Analytics admin also manages data sources and shared dashboards.
- The Sales and Accounts access packs include Analytics.
- Record-level permissions always apply: a query never shows a record the person could not open elsewhere.
Still stuck?
Ask the team that set it up.
In MyRecords, Show me how walks you through any page. For your plan or a change, write to us.
- Updates and fixes included
- Changes whenever you want