
Analytics
Your numbers, without asking anyone.
A business overview, saved dashboards and a query builder over your own records. No code, no exports to Excel.
- Works today on the demo company
- Live demo sign-in from us, on request
- Your server or MyRecords Cloud
- Built for you
- Customised
- to your requirements, by our team
- Users
- Unlimited
- no per-user fees, on any module
- Runs on
- Your server or MyRecords Cloud
- a dedicated system, in any country
What it fixes
What changes with Analytics.
In short
Analytics is the reporting layer of MyRecords: a business overview of sales, purchases, profit and cash, stock, CRM, support, HR and loans for any period; saved charts and dashboards you can pin to Home or get by e-mail; and Build a query, which makes a chart or table from 28 business objects without code. It reads the same records the rest of MyRecords writes, and it shows each person only the records they are allowed to see.
-
Before: Monthly figures arrive late, in Excel, from the accountant.
With Analytics: The business overview shows revenue, collections, receivables, profit and cash for any period, any day.
-
Before: Sales went down, and nobody can say why.
With Analytics: “What changed” lists the figures that moved 10 % or more. Click a figure to open the records behind it.
-
Before: Every new question means asking someone to make a new report.
With Analytics: Build a query asks what to look at, the measure and the breakdown. No code, no SQL.
-
Before: The sales team and the accounts team quote different numbers.
With Analytics: Both read the same books, and each figure is defined once. Revenue is always submitted sales invoices in the period.
What it does
What Analytics does for you.
Everything here works today on the demo company.
- 01
Business overview
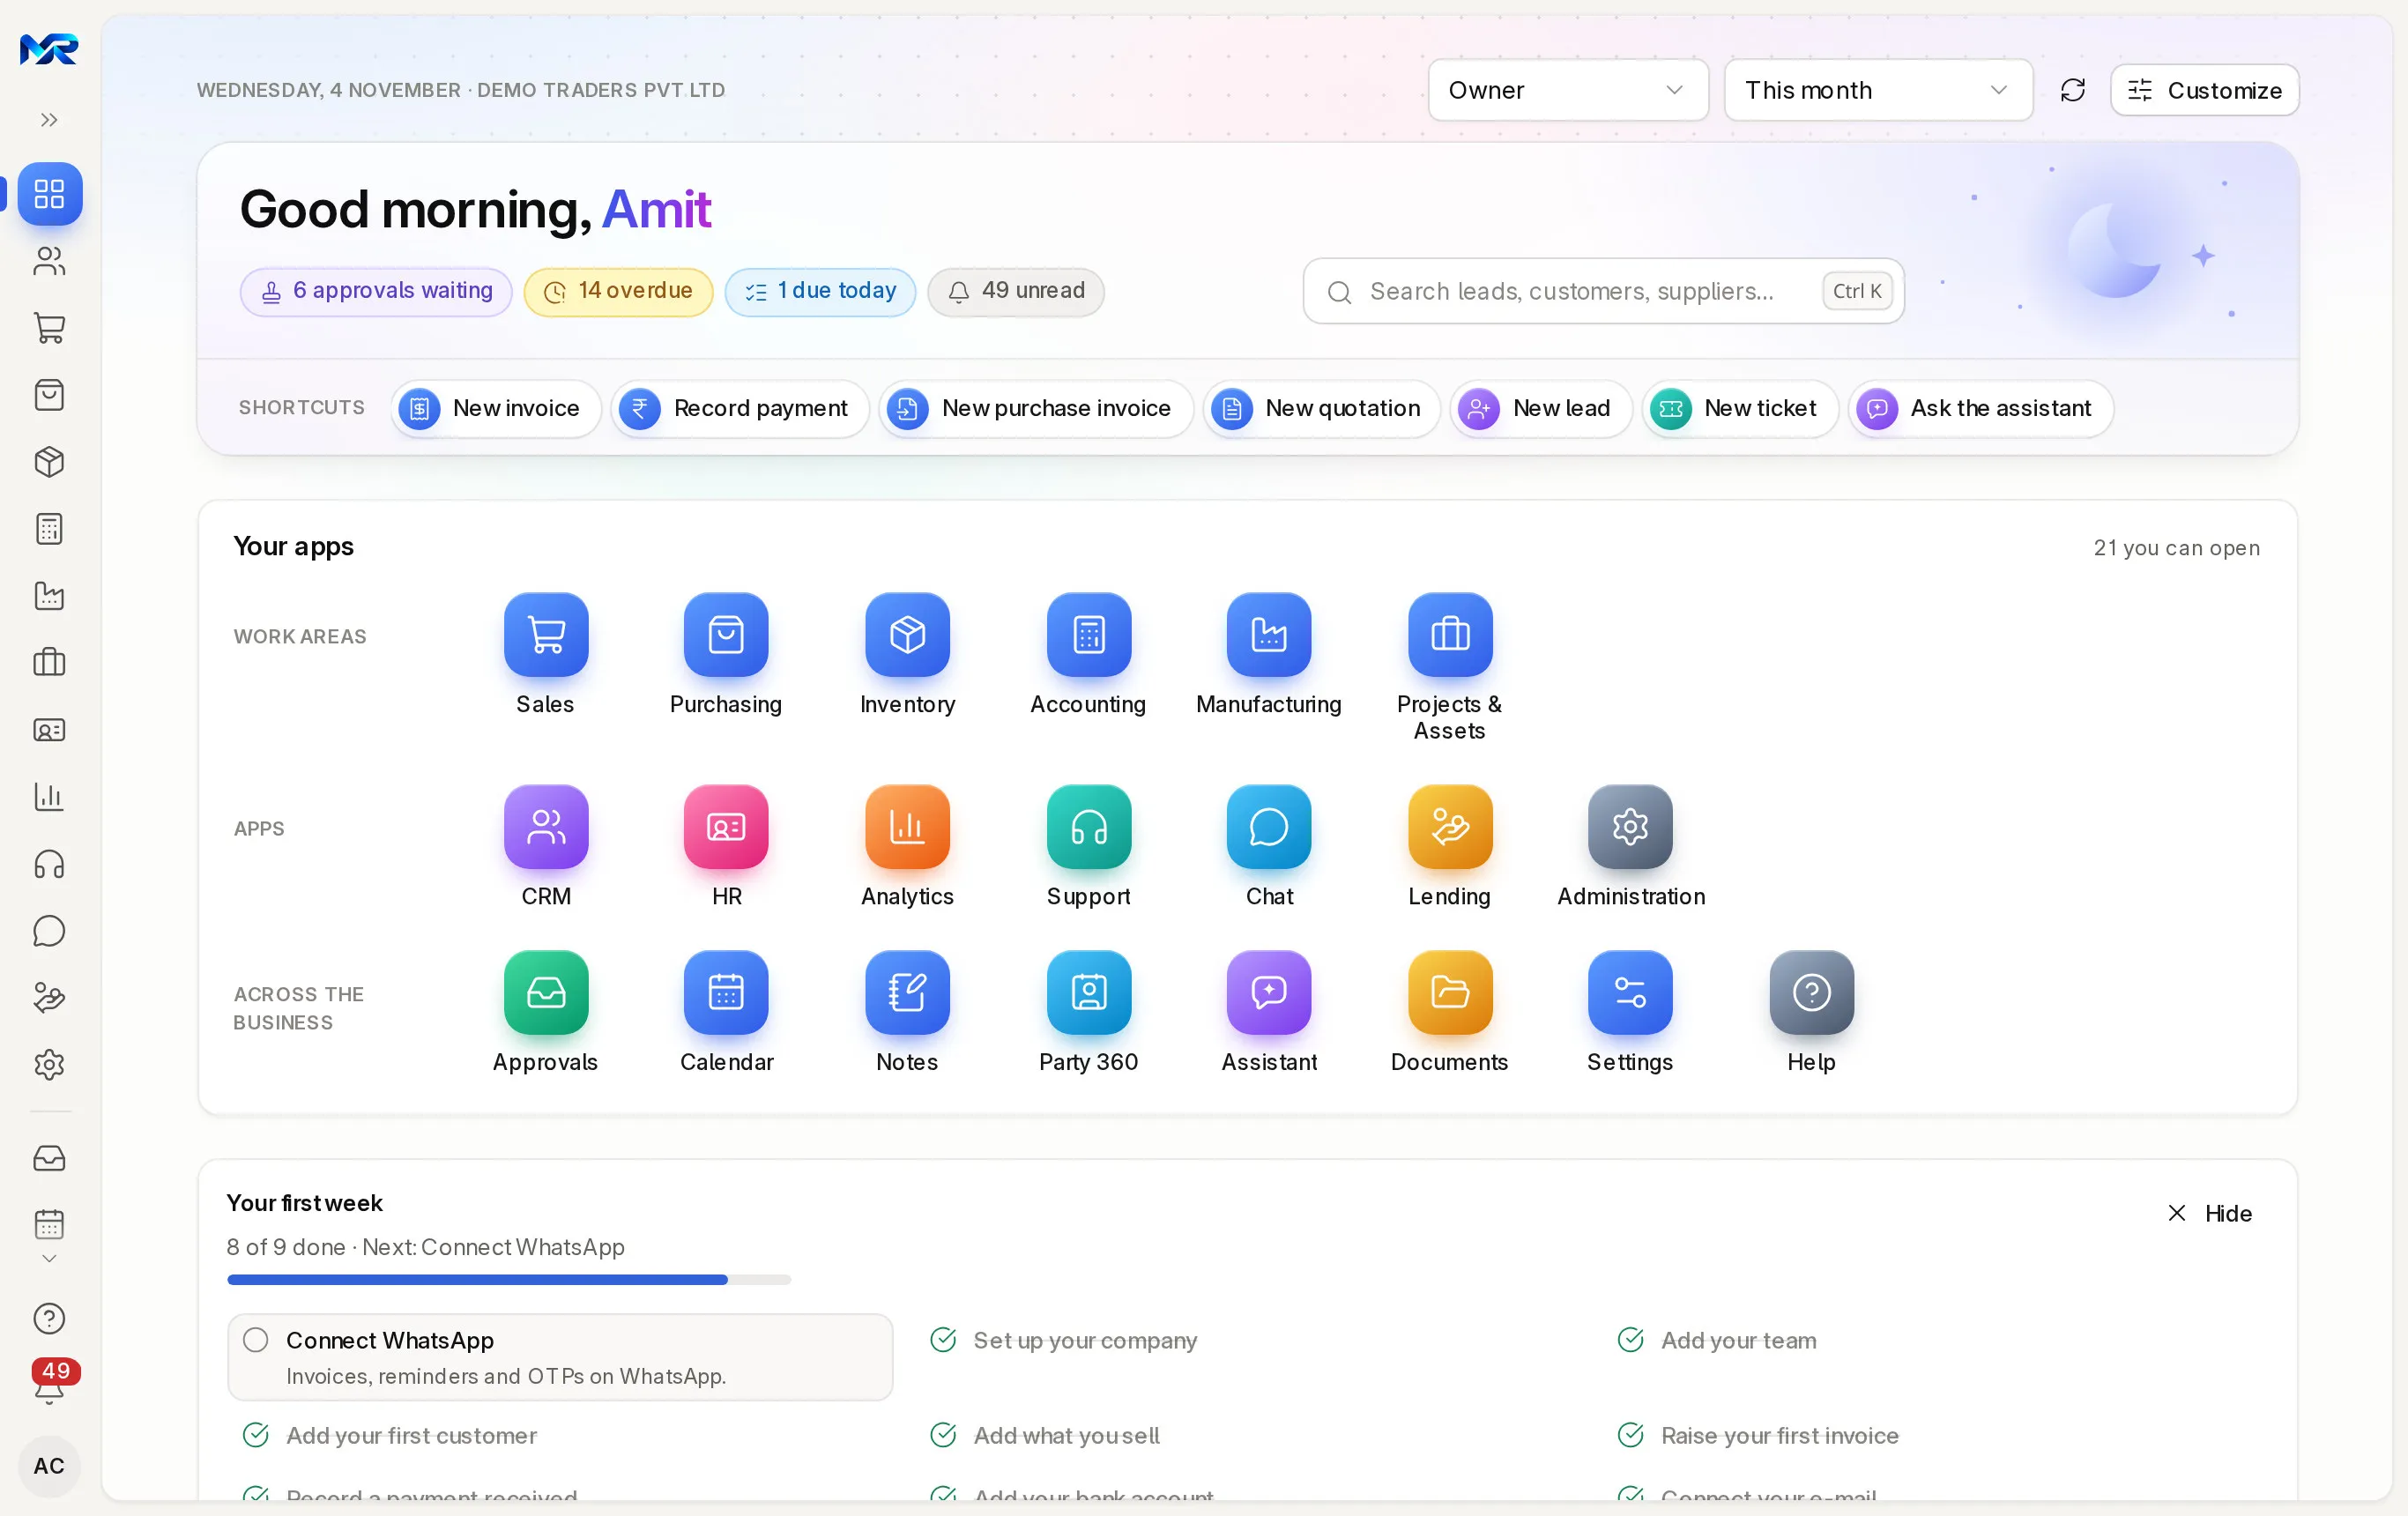
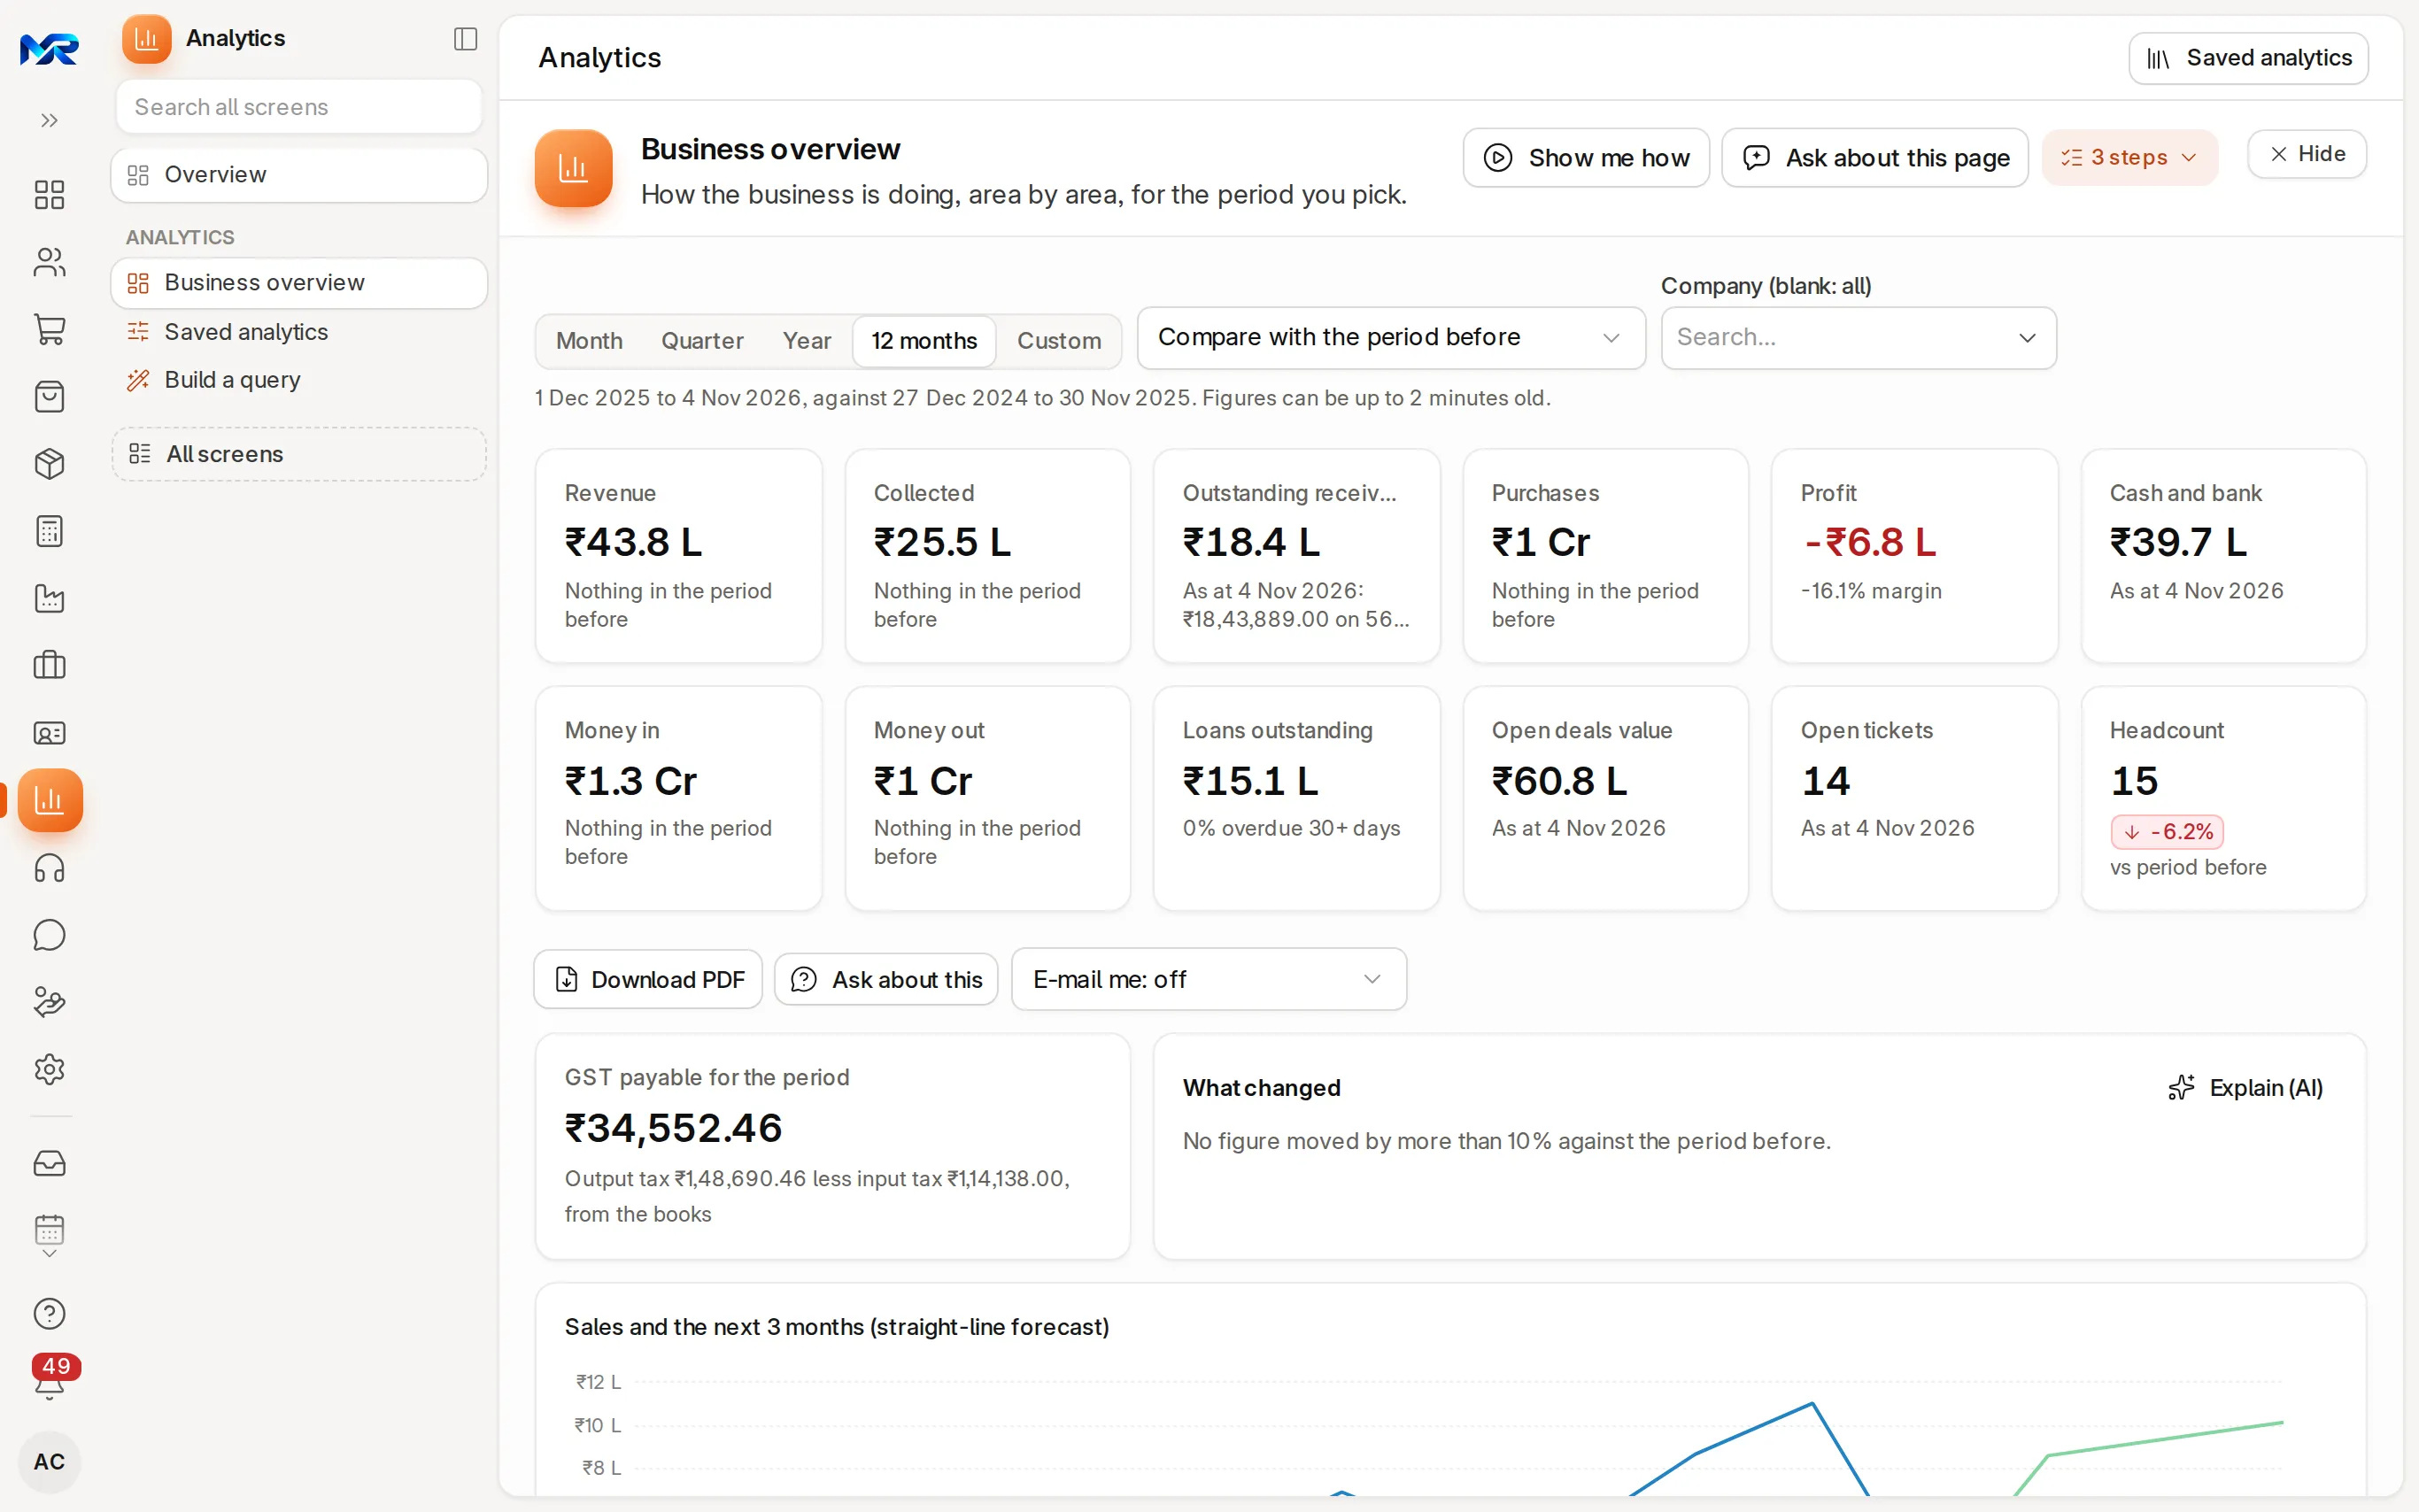
Revenue, collected, receivables, purchases, profit, cash and bank, money in and out, loans, open deals, open tickets and headcount. Pick a month, quarter, year, 12 months or your own dates, and compare with the period before or the same period last year. Click any figure or bar to open the records behind it.
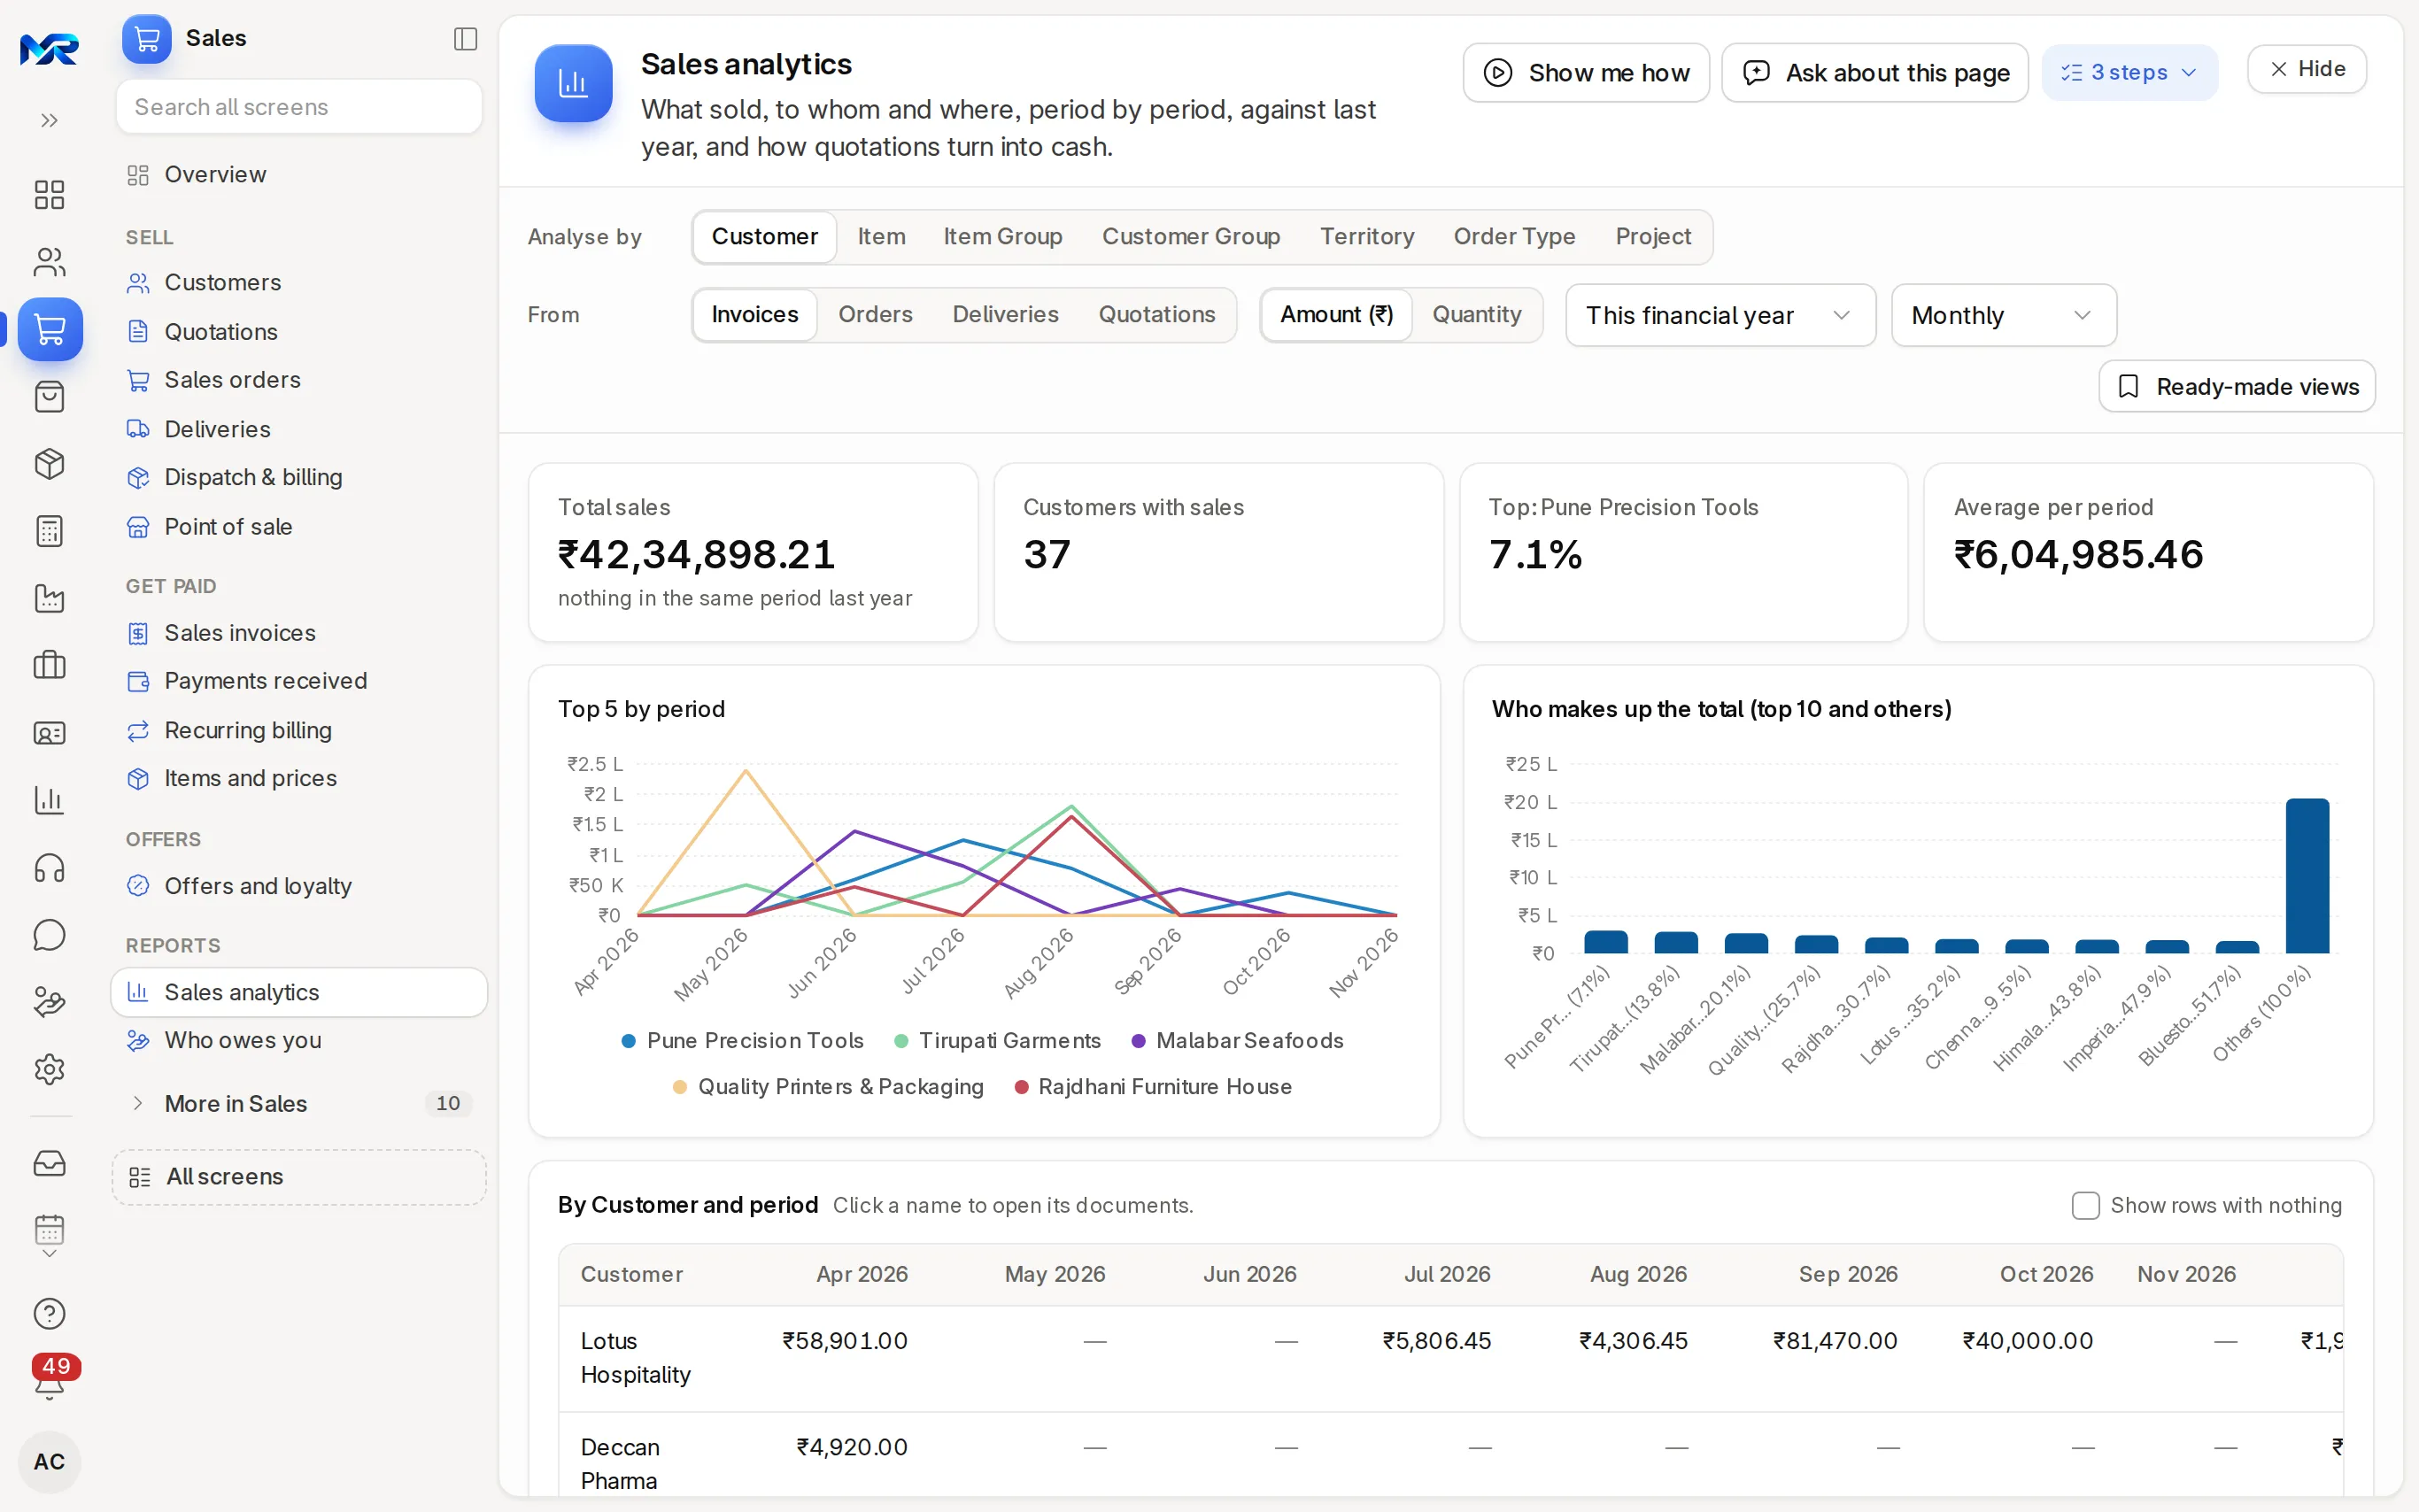
Sales analytics, month by month. - 02
What changed
The overview lists the figures that moved 10 % or more against the comparison. With AI Assistant on, “Explain (AI)” writes it out in plain words from those figures only, and “Ask about this” takes them to the assistant.
- 03
Sales forecast
“Sales and the next 3 months” draws a straight line through your last 12 months of sales. A guide, not a promise.
- 04
Build a query
Pick one of 28 business objects (sales invoices, items, customers, employees, tickets, loans and more) or any other list you can open. Then a measure, a breakdown and conditions such as “last financial year”. The answer redraws as you go, in ten chart types from bars and donuts to pivots and a single number.
- 05
Pivots, combining and calculated columns
Pivot with totals, add up to four calculated columns and colour cells with highlight rules. Bring in fields from related records, add rows from another list or combine with it. Click a bar or row to see its records.
- 06
Saved dashboards
Saved analytics keeps your charts, dashboards, queries and alerts. A dashboard has its own filters and an edit mode. Four ready-made dashboards cover sales, receivables and cash, inventory and purchasing.
- 07
Pin charts to Home
“Add to my dashboard” puts an overview chart on your Home page, with the filters it had. Up to six, redrawn from the books each time you open Home.
- 08
E-mail and alerts
Get the overview as a PDF by e-mail, daily, weekly or monthly, or a saved chart or dashboard every Monday. “Alert me when…” checks a query every hour, day, week or month and e-mails you when a figure crosses your line.
- 09
Share
Share a query's workbook with colleagues or everyone in Analytics, to view or to edit. Each person still sees only the records they may see.
- 10
Ask in plain words
Type “sales by customer this financial year, biggest first” and Build a query fills in the steps for you to check. “Explain this result” and “Suggest the sum” for a calculated column work the same way. With the AI Assistant add-on.
India compliance
For businesses in India, built in.
India is our first fully supported market. Each line says whether it works today, once you connect your account, or in part.
Outside India
Outside India, everything else on this page works the same in your own currency. These lines are extras for businesses in India.
What works in your country- Works today
Lakh and crore
Figures show as ₹32.8 L or ₹1.2 Cr on cards and in full Indian grouping in tables, such as ₹1,82,450.
- Works today
Financial year built in
Break down by quarter or financial year (April–March), and filter with relative dates such as “this financial year” or “last financial year”.
- Works today
India map
A state-wise India map chart for sales, customers or tickets by state.
- Works today
GST payable at a glance
The overview shows output tax less input tax from the books for the period, or the credit to carry forward, so you know the cash GST will need.
Try it
See it work on sample data.
We show you the live system on a call: the demo company's business overview for the last 12 months, then the four sample dashboards in Saved analytics. Ask for a demo sign-in to explore it yourself, or join the pilot programme and see it on your own books.
Business overview
Kaveri Agencies · Nov 2025 – Oct 2026
-
Revenue
₹2.46 Cr
+14% vs period before -
Collected
₹2.18 Cr
+11% vs period before -
Outstanding receivables
₹28.4 L
As at 31 Oct 2026 -
Cash and bank
₹16.9 L
+6% vs period before
Revenue by month
Still to collect on 31 Oct 2026 ₹28,41,250
Sample data for a fictional distributor. Your own overview reads your books.
Reports and roles
What you see, and who sees it.
Reports come ready on day one. Each person sees only the screens and records their role allows.
Reports you get
- Business overview, with GST payable, what changed and the 3-month forecast
- Revenue by month, top customers and sales by item group
- Receivables and payables ageing (days overdue)
- Income and expenses, money in and out, cash and bank balances
- Top items by stock value and stock health
- Pipeline value by stage, leads by source, deals won and lost
- Tickets opened and resolved, headcount by department, loans outstanding
- Ready-made dashboards: Sales Performance; Receivables, Payables & Cash; Inventory Health; Purchasing Overview
- Any chart or table you build
Who sees what
- Owner
- Usually an administrator, so sees every figure and dashboard and shares them with the team.
- Sales and accounts staff
- Open the overview and dashboards, build their own queries, save and share charts, and set alerts.
- Administrator
- Add the ready-made dashboards and data sources, and write read-only SQL or a script when a query needs it.
- Everyone else
- Analytics is not in their menu unless their role includes it. The overview leaves out any area a person cannot see.
Before you decide
What works today, and what does not.
Said plainly, so you can plan around it. What comes next is on the roadmap.
Works today14
On the demo company, now.
- Business overview
- What changed
- Sales forecast
- Build a query
- Pivots, combining and calculated columns
- Saved dashboards
- Pin charts to Home
- E-mail and alerts
- Share
- Ask in plain words
- Lakh and crore
- Financial year built in
- India map
- GST payable at a glance
Not in Analytics yet
Left out on purpose, or planned.
- Live feeds from banks, Shopify or marketplaces; figures come only from what is recorded in MyRecords.
- Building queries step by step on a phone screen; phones get the overview, dashboards and “Ask in plain words”.
- A saved query cannot compare against figures still in your old software.
- On a phone
- The overview, saved charts and dashboards work in any phone browser. On a phone, Build a query offers only “Ask in plain words”, which needs AI Assistant; building step by step needs a wider screen. Analytics needs a connection; only point of sale, the shop floor, attendance check-in, maintenance visits and asset physical checks keep working offline, and bill photos for Read a bill wait on the phone and upload when the network is back.
- Bringing data in
- Nothing to import: Analytics reads the records already in MyRecords. A module that is switched off reads as empty.
- Getting data out
- Each overview chart downloads as PNG or CSV, and the whole overview as a PDF. A query's answer downloads as Excel or CSV and its chart as PNG. By e-mail: the overview as a PDF, daily, weekly or monthly; a saved chart or dashboard every Monday, as a table of its figures.
- Integrations
- An administrator can add an outside database as a data source with a read-only login. There are no live feeds from banks or online marketplaces, so those figures come from what is recorded in MyRecords.
- Where it runs
- Analytics runs inside your own dedicated system, on your server under an AMC or on MyRecords Cloud. Queries run against your own database; nothing is sent to an outside reporting service. Data ownership and exit
Questions
Questions people ask
Something else on your mind?
Ask us anything about modules, a quote or moving across. A person from our team replies.
Ask a question01Do I need to know SQL?
No. Build a query works by picking a business object, a measure, a breakdown and conditions. Administrators can write read-only SQL if they want to, but nobody has to.
02Will my sales staff see salaries or the bank balance?
No. Analytics shows each person only the records their role allows. The query builder's results follow the same record permissions as every list and report.
03Which business objects can I query?
28 of them, including sales and purchase invoices, orders, payments, ledger entries, items and stock movements, customers and suppliers, leads and deals, tickets, employees, attendance, leave, salary slips, expense claims, projects, timesheets, work orders and loans, and any other list you can open. You see only the ones your role may read.
04Can I get the dashboard on e-mail every Monday?
Yes. The envelope button on a dashboard or saved chart sends it every Monday as a table of its figures. The business overview comes as a PDF, daily, weekly or monthly.
05Are the numbers live?
Yes. The overview reads the books when you open it; its figures can be up to 2 minutes old. Dashboards run their queries as they open, and Refresh runs them again.
06Does Analytics need AI?
No. Dashboards, the overview, the forecast and the query builder work without it. Only “Ask in plain words”, “Explain” and “Ask about this” need AI Assistant switched on.
07Is there a per-user charge for viewing dashboards?
No. Users are unlimited on every module. You pay for the modules you switch on, never per person.
Last updated Applies to MyRecords 3 Nov 2026 release
Next step
See it on your own numbers.
A live demo on our sample company, with the modules you would switch on. Or ask us for a quote first.
Live demo
Book a walk-through
- On our sample company, for your kind of work
- A quote for the modules you need
- Your questions, answered by our team