How it works
- Lead-time demand = average daily sales × usual lead time.
- Safety stock = (highest daily sales × longest lead time) − lead-time demand.
- Reorder point = lead-time demand + safety stock.
- EOQ = √(2 × D × S ÷ H), where D is yearly demand, S the cost of placing one order and H the cost of holding one unit for a year.
- Orders a year = D ÷ EOQ; days between orders = 365 ÷ orders a year.
Worked example
Shree Lakshmi Hardware sells on average 40 bags of wall putty a day. Its supplier usually takes 7 days; at worst, sales hit 55 a day and delivery takes 10 days. Placing an order costs ₹500 (calls, transport, receiving) and holding a bag for a year costs ₹12.
- Lead-time demand: 40 × 7 = 280 bags.
- Safety stock: 55 × 10 − 280 = 270 bags.
- Reorder point: 280 + 270 = 550 bags.
- Yearly demand: 40 × 365 = 14,600 bags. EOQ = √(2 × 14,600 × 500 ÷ 12) = 1,103 bags, about 13 orders a year, one every 28 days.
Notes and edge cases
- Seasonal items: use the average and peak for the coming season, not the whole year.
- Lumpy demand: if a few large orders dominate, a reorder point based on daily averages will mislead; plan those orders separately.
- Expiry: for items with a short shelf life, keep the order size below what you can sell before expiry, even if EOQ says more.
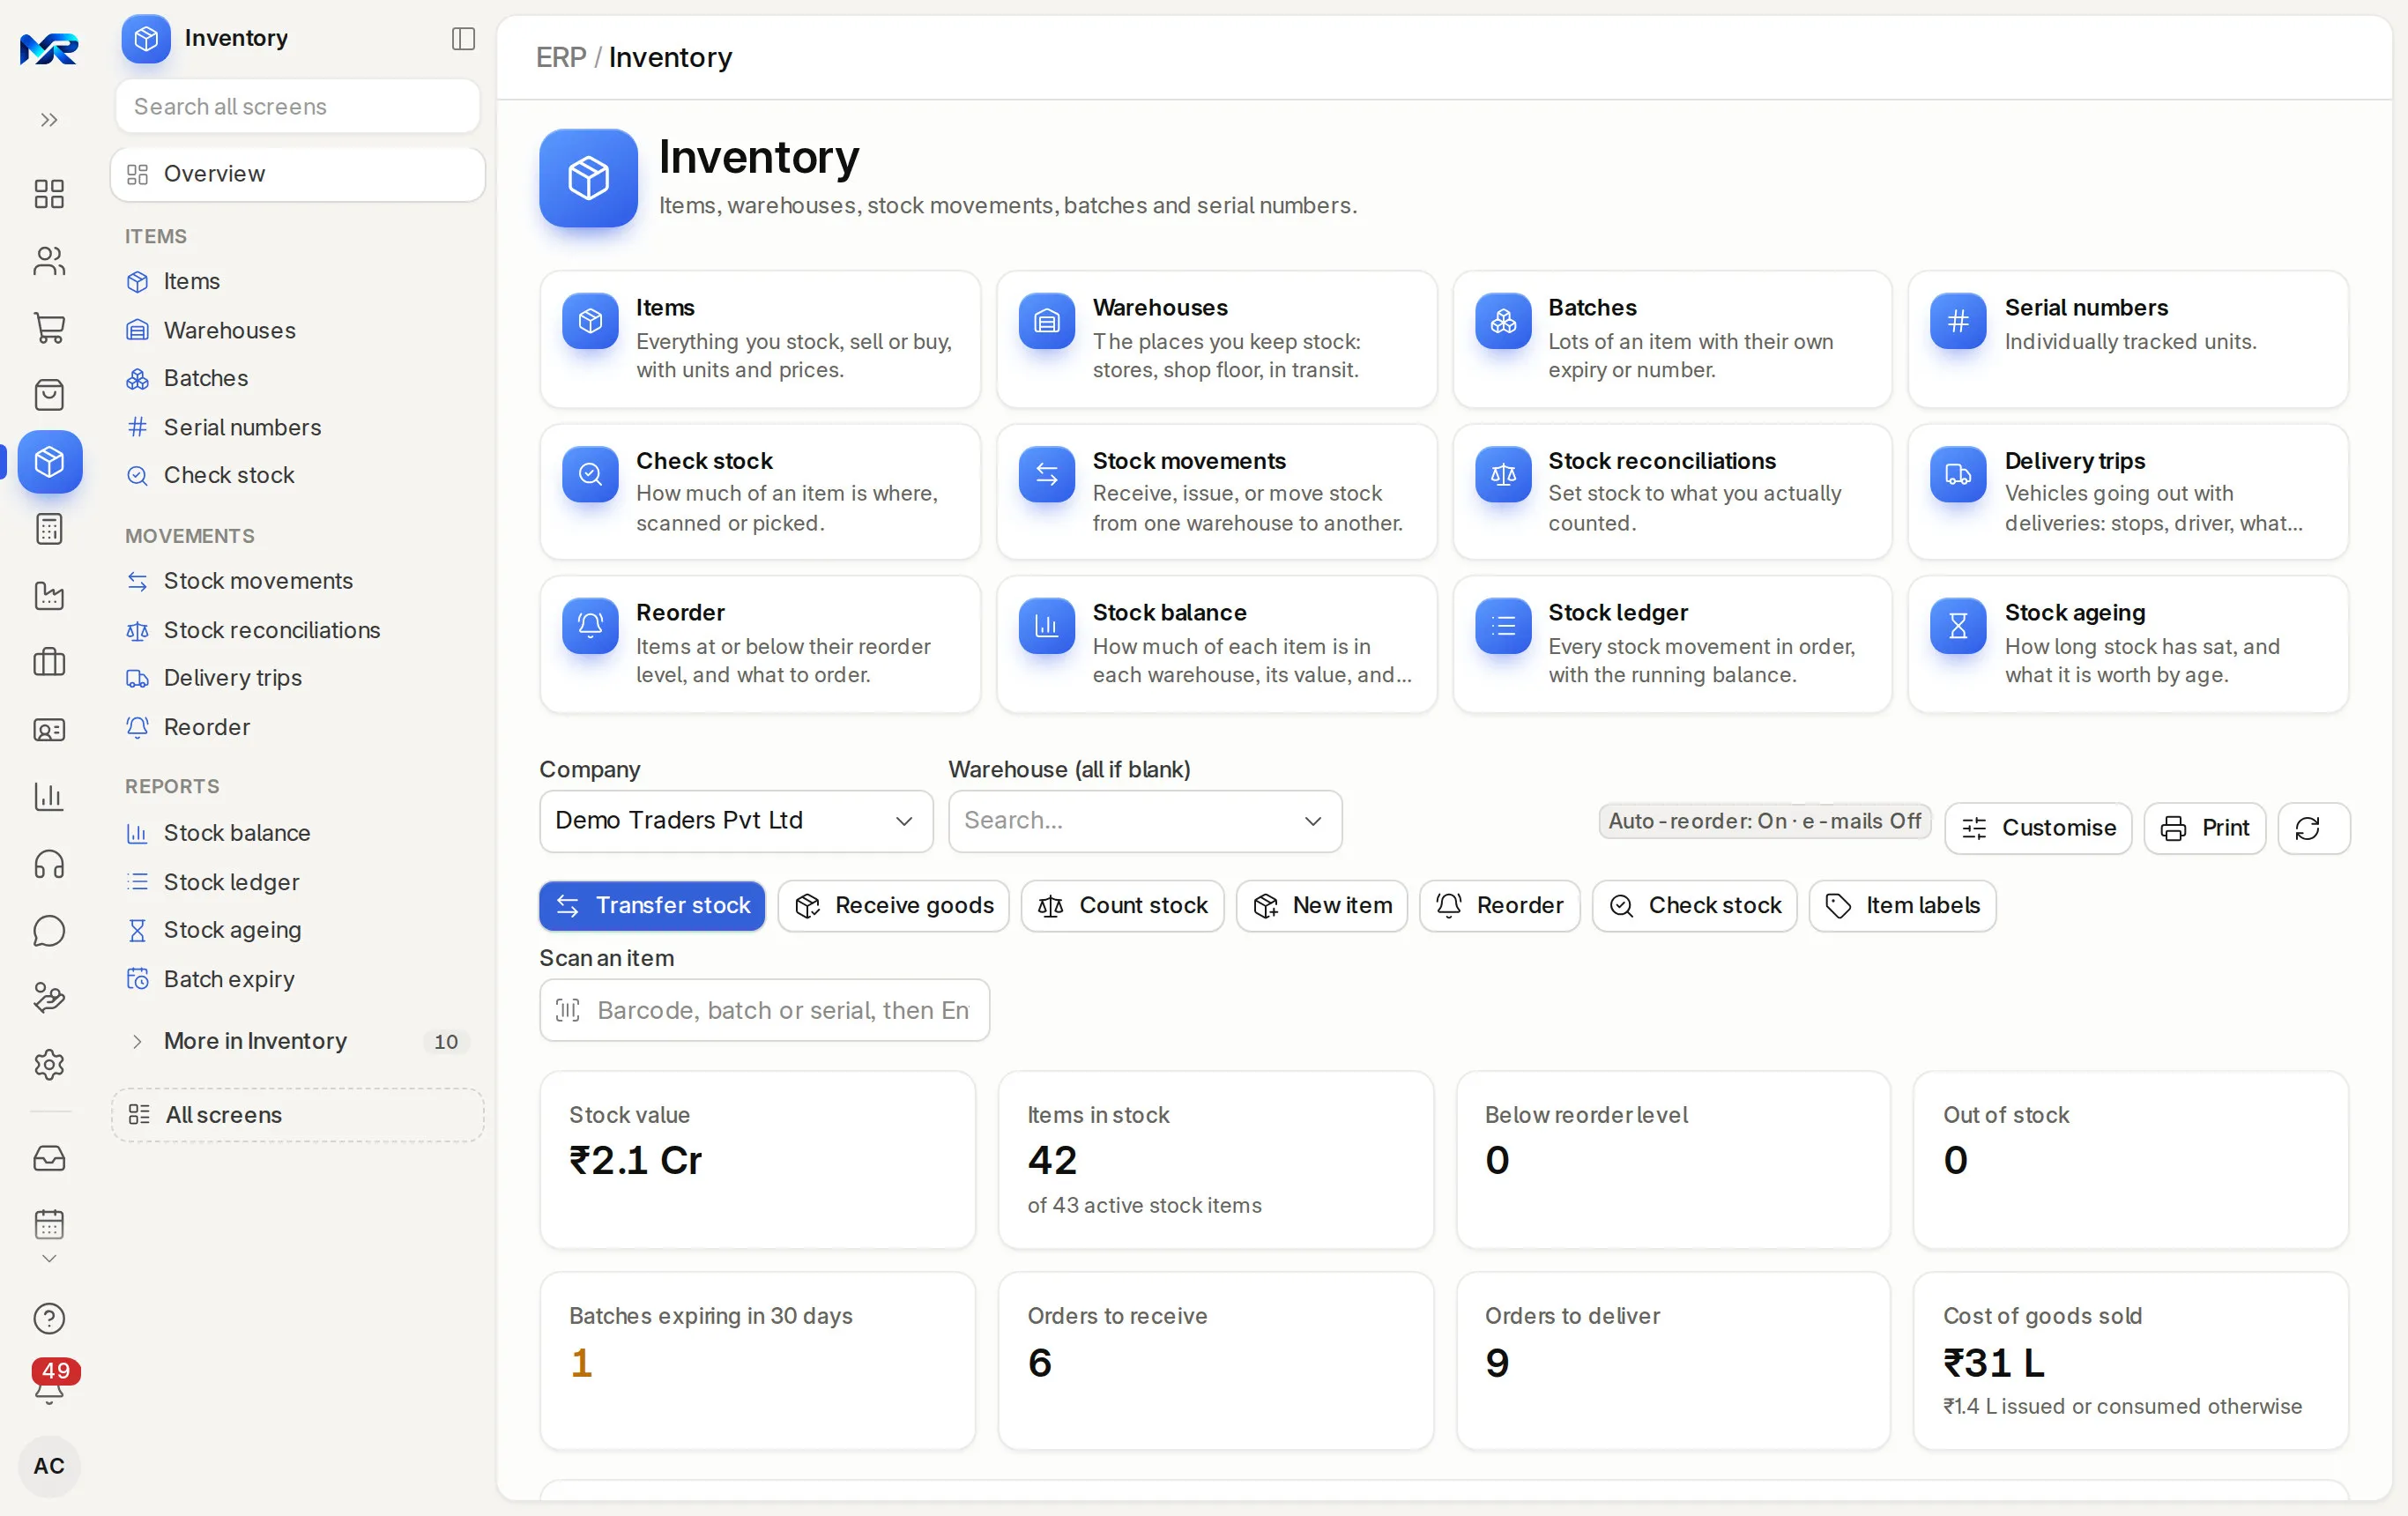
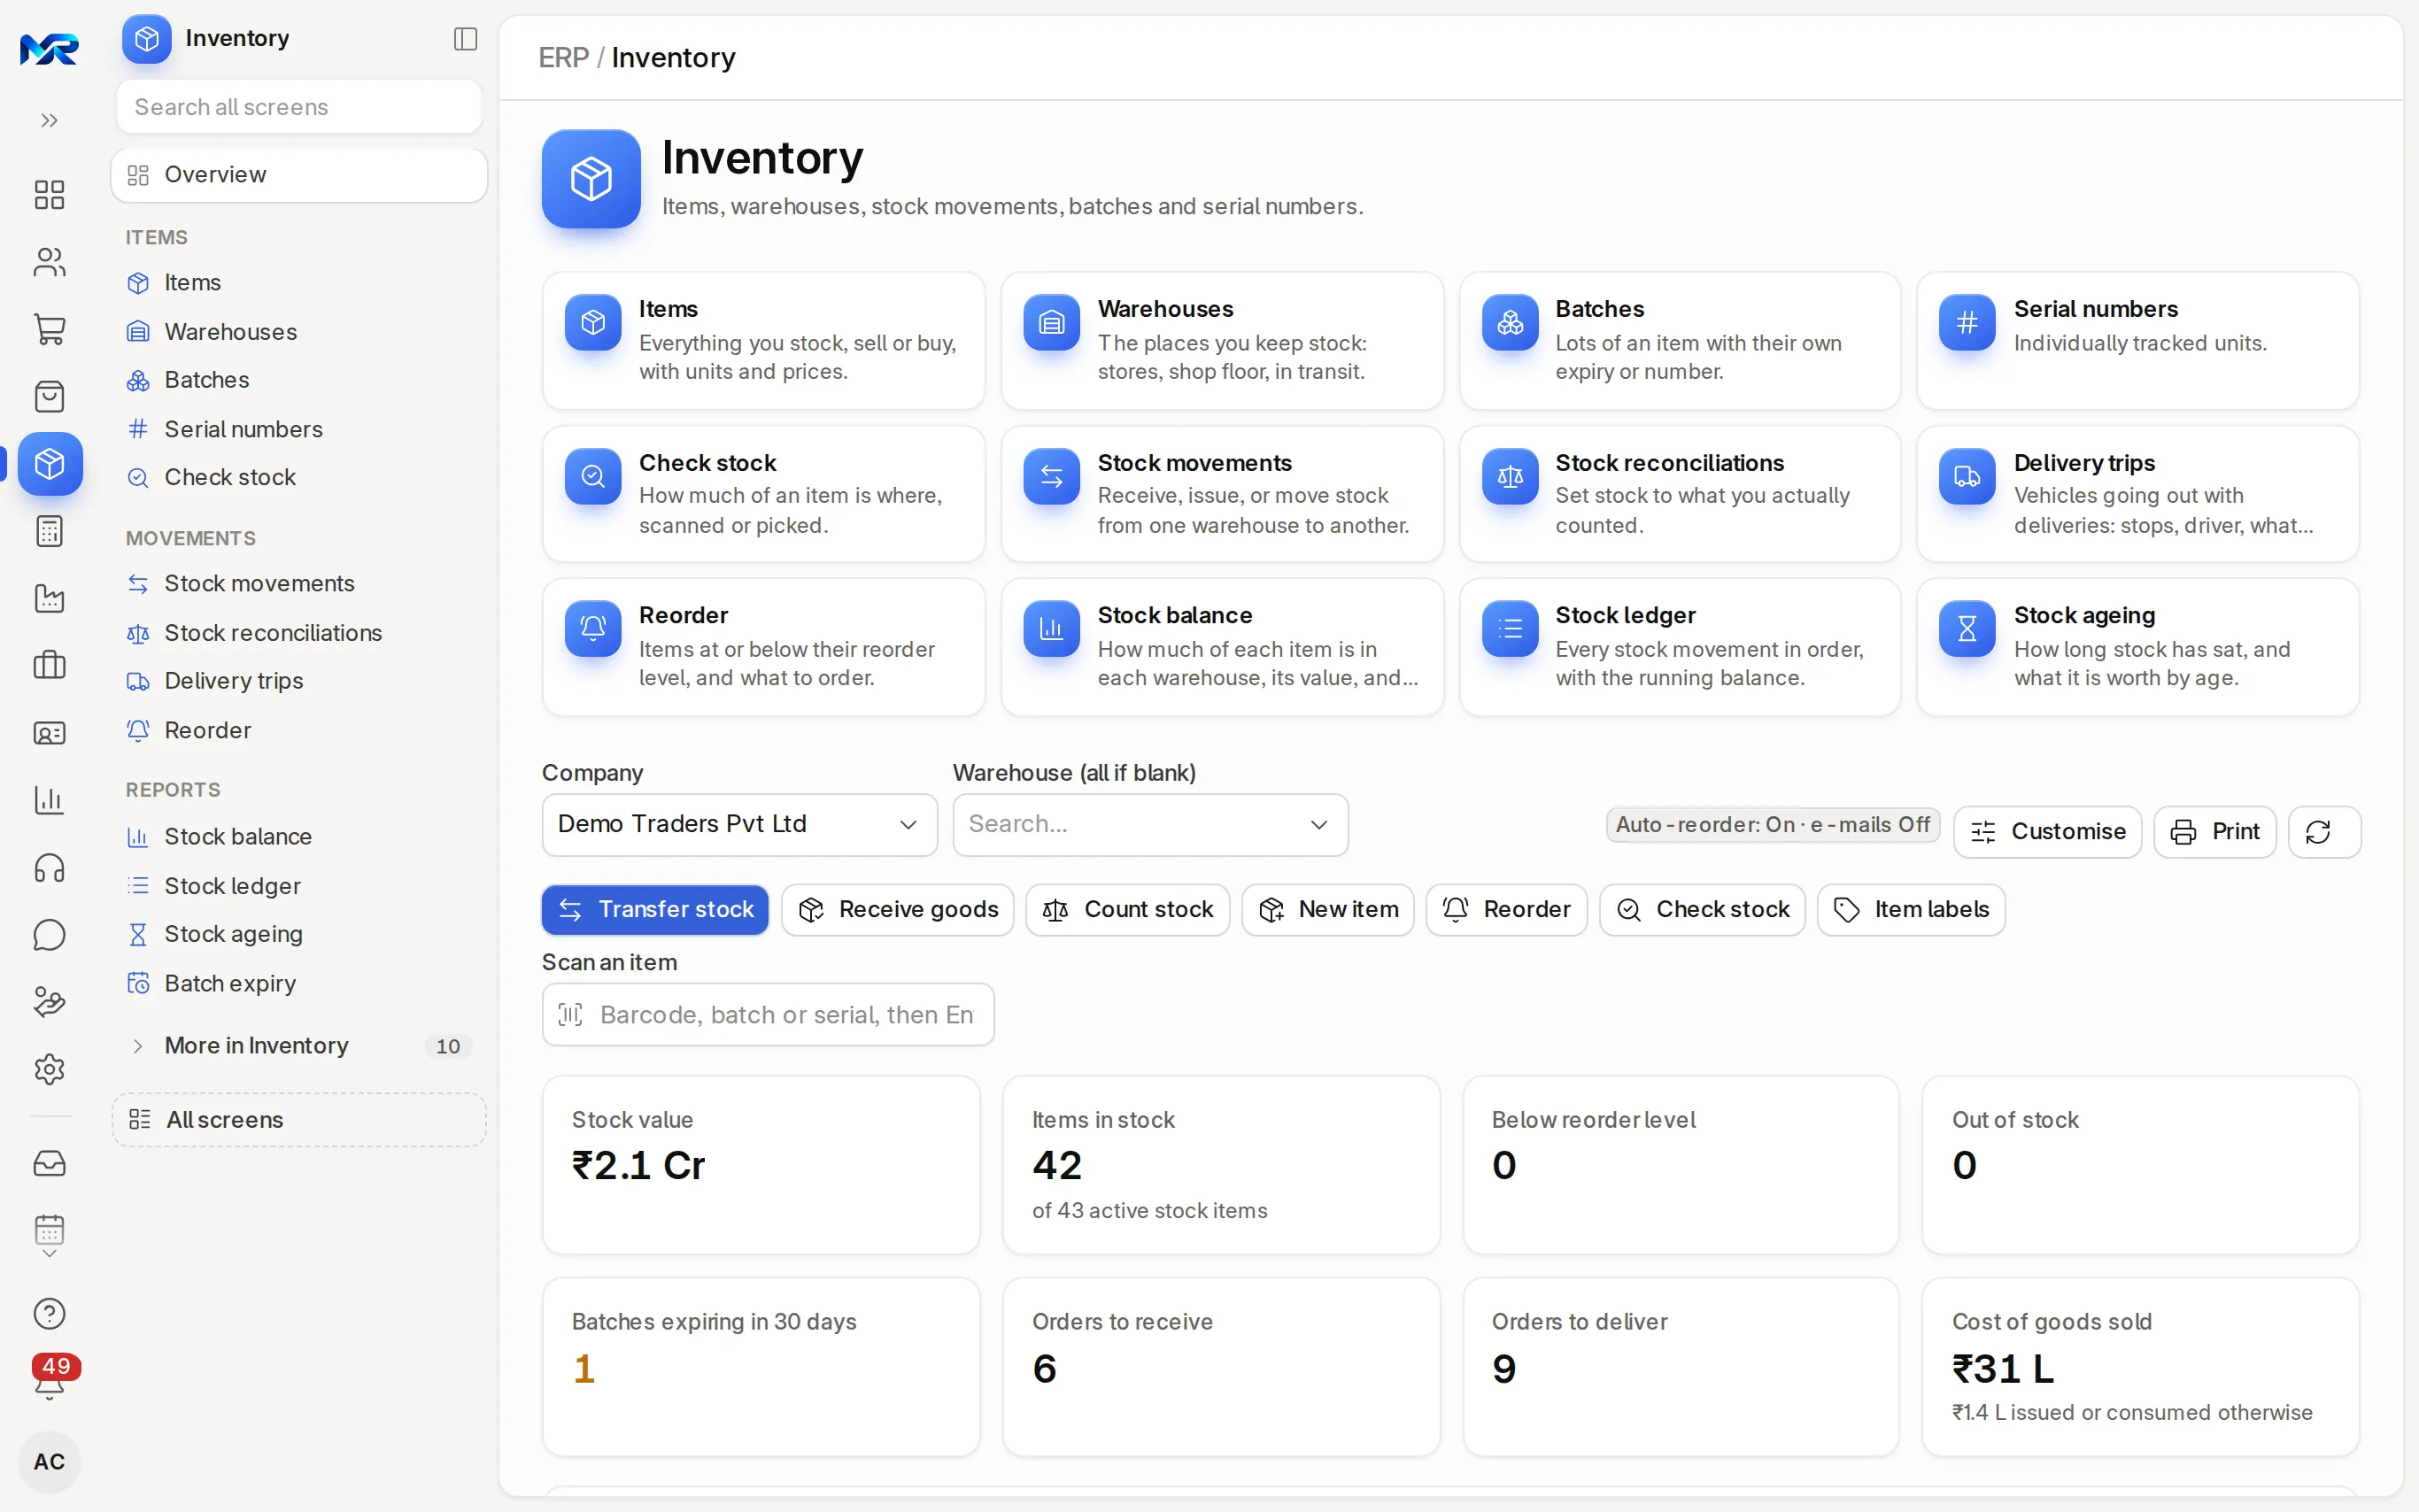
- Inventory in MyRecords keeps a reorder level per item and warehouse. Its Reorder page lists what has run down and turns it into draft material requests or purchase orders.